Dudley Housing

Although the American Community Survey (ACS) produces population, demographic and housing unit estimates, it is the Census Bureau’s Population Estimates Program that produces and disseminates the official estimates of the population for the nation, states, counties, cities and towns and estimates of housing units for states and counties.
Housing Information
Rent
| Subject | Estimate | Margin of Error | Percent |
|---|---|---|---|
| HOUSING OCCUPANCY | |||
| Total housing units | 4,441 | +/-285 | 4,441 |
| Occupied housing units | 4,135 | +/-243 | 93.1% |
| Vacant housing units | 306 | +/-122 | 6.9% |
| Homeowner vacancy rate | 1.9 | +/-2.1 | (X) |
| Rental vacancy rate | 5.9 | +/-4.8 | (X) |
| UNITS IN STRUCTURE | |||
| Total housing units | 4,441 | +/-285 | 4,441 |
| 1-unit, detached | 3,154 | +/-280 | 71.0% |
| 1-unit, attached | 25 | +/-27 | 0.6% |
| 2 units | 440 | +/-164 | 9.9% |
| 3 or 4 units | 477 | +/-136 | 10.7% |
| 5 to 9 units | 242 | +/-118 | 5.4% |
| 10 to 19 units | 17 | +/-20 | 0.4% |
| 20 or more units | 86 | +/-65 | 1.9% |
| Mobile home | 0 | +/-19 | 0.0% |
| Boat, RV, van, etc. | 0 | +/-19 | 0.0% |
| YEAR STRUCTURE BUILT | |||
| Total housing units | 4,441 | +/-285 | 4,441 |
| Built 2010 or later | 0 | +/-19 | 0.0% |
| Built 2000 to 2009 | 611 | +/-147 | 13.8% |
| Built 1990 to 1999 | 297 | +/-107 | 6.7% |
| Built 1980 to 1989 | 562 | +/-138 | 12.7% |
| Built 1970 to 1979 | 695 | +/-154 | 15.6% |
| Built 1960 to 1969 | 419 | +/-151 | 9.4% |
| Built 1950 to 1959 | 771 | +/-220 | 17.4% |
| Built 1940 to 1949 | 174 | +/-63 | 3.9% |
| Built 1939 or earlier | 912 | +/-179 | 20.5% |
| ROOMS | |||
| Total housing units | 4,441 | +/-285 | 4,441 |
| 1 room | 0 | +/-19 | 0.0% |
| 2 rooms | 39 | +/-38 | 0.9% |
| 3 rooms | 93 | +/-54 | 2.1% |
| 4 rooms | 769 | +/-212 | 17.3% |
| 5 rooms | 1,129 | +/-242 | 25.4% |
| 6 rooms | 982 | +/-196 | 22.1% |
| 7 rooms | 880 | +/-187 | 19.8% |
| 8 rooms | 220 | +/-86 | 5.0% |
| 9 rooms or more | 329 | +/-107 | 7.4% |
| Median rooms | 5.7 | +/-0.3 | (X) |
| BEDROOMS | |||
| Total housing units | 4,441 | +/-285 | 4,441 |
| No bedroom | 0 | +/-19 | 0.0% |
| 1 bedroom | 308 | +/-128 | 6.9% |
| 2 bedrooms | 1,376 | +/-274 | 31.0% |
| 3 bedrooms | 2,150 | +/-268 | 48.4% |
| 4 bedrooms | 525 | +/-122 | 11.8% |
| 5 or more bedrooms | 82 | +/-51 | 1.8% |
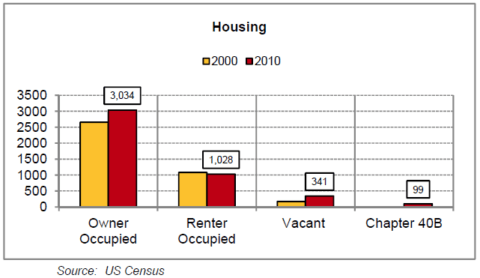
| HOUSING TENURE | |||
| Occupied housing units | 4,135 | +/-243 | 4,135 |
| Owner-occupied | 3,107 | +/-297 | 75.1% |
| Renter-occupied | 1,028 | +/-209 | 24.9% |
| Average household size of owner-occupied unit | 2.64 | +/-0.14 | (X) |
| Average household size of renter-occupied unit | 2.48 | +/-0.39 | (X) |
| YEAR HOUSEHOLDER MOVED INTO UNIT | |||
| Occupied housing units | 4,135 | +/-243 | 4,135 |
| Moved in 2010 or later | 497 | +/-156 | 12.0% |
| Moved in 2000 to 2009 | 2,013 | +/-257 | 48.7% |
| Moved in 1990 to 1999 | 529 | +/-139 | 12.8% |
| Moved in 1980 to 1989 | 361 | +/-108 | 8.7% |
| Moved in 1970 to 1979 | 439 | +/-149 | 10.6% |
| Moved in 1969 or earlier | 296 | +/-123 | 7.2% |
| HOUSE HEATING FUEL | |||
| Occupied housing units | 4,135 | +/-243 | 4,135 |
| Utility gas | 774 | +/-187 | 18.7% |
| Bottled, tank, or LP gas | 62 | +/-51 | 1.5% |
| Electricity | 751 | +/-220 | 18.2% |
| Fuel oil, kerosene, etc. | 2,146 | +/-254 | 51.9% |
| Coal or coke | 47 | +/-56 | 1.1% |
| Wood | 229 | +/-95 | 5.5% |
| Solar energy | 17 | +/-26 | 0.4% |
| Other fuel | 109 | +/-66 | 2.6% |
| No fuel used | 0 | +/-19 | 0.0% |
| VALUE | |||
| Owner-occupied units | 3,107 | +/-297 | 3,107 |
| Less than $50,000 | 73 | +/-46 | 2.3% |
| $50,000 to $99,999 | 118 | +/-93 | 3.8% |
| $100,000 to $149,999 | 179 | +/-104 | 5.8% |
| $150,000 to $199,999 | 454 | +/-123 | 14.6% |
| $200,000 to $299,999 | 1,372 | +/-225 | 44.2% |
| $300,000 to $499,999 | 830 | +/-209 | 26.7% |
| $500,000 to $999,999 | 66 | +/-65 | 2.1% |
| $1,000,000 or more | 15 | +/-23 | 0.5% |
| Median (dollars) | 248,600 | +/-13,256 | (X) |
| MORTGAGE STATUS | |||
| Owner-occupied units | 3,107 | +/-297 | 3,107 |
| Housing units with a mortgage | 2,316 | +/-279 | 74.5% |
| Housing units without a mortgage | 791 | +/-165 | 25.5% |
| SELECTED MONTHLY OWNER COSTS (SMOC) | |||
| Housing units with a mortgage | 2,316 | +/-279 | 2,316 |
| Less than $300 | 0 | +/-19 | 0.0% |
| $300 to $499 | 9 | +/-15 | 0.4% |
| $500 to $699 | 66 | +/-44 | 2.8% |
| $700 to $999 | 189 | +/-111 | 8.2% |
| $1,000 to $1,499 | 579 | +/-148 | 25.0% |
| $1,500 to $1,999 | 804 | +/-176 | 34.7% |
| $2,000 or more | 669 | +/-157 | 28.9% |
| Median (dollars) | 1,663 | +/-89 | (X) |
| Housing units without a mortgage | 791 | +/-165 | 791 |
| Less than $100 | 0 | +/-19 | 0.0% |
| $100 to $199 | 12 | +/-20 | 1.5% |
| $200 to $299 | 67 | +/-83 | 8.5% |
| $300 to $399 | 133 | +/-74 | 16.8% |
| $400 or more | 579 | +/-155 | 73.2% |
| Median (dollars) | 479 | +/-40 | (X) |
| Occupied units paying rent | 948 | +/-209 | 948 |
| Less than $200 | (X) | +/-19 | 0.0% |
| $200 to $299 | (X) | +/-19 | 0.0% |
| $300 to $499 | (X) | +/-29 | 1.9% |
| $500 to $749 | (X) | +/-115 | 24.9% |
| $750 to $999 | (X) | +/-127 | 34.6% |
| $1,000 to $1,499 | (X) | +/-135 | 33.2% |
| $1,500 or more | (X) | +/-46 | 5.4% |
| Median (dollars) | (X) | +/-88 | (X) |
| No rent paid | 80 | +/-63 | (X) |
| GROSS RENT AS A PERCENTAGE OF HOUSEHOLD INCOME (GRAPI) | |||
| Occupied units paying rent (excluding units where GRAPI cannot be computed) | 940 | +/-208 | 940 |
| Less than 15.0 percent | 91 | +/-80 | 9.7% |
| 15.0 to 19.9 percent | 227 | +/-117 | 24.1% |
| 20.0 to 24.9 percent | 91 | +/-87 | 9.7% |
| 25.0 to 29.9 percent | 195 | +/-110 | 20.7% |
| 30.0 to 34.9 percent | 44 | +/-45 | 4.7% |
| 35.0 percent or more | 292 | +/-124 | 31.1% |